Polluted Karabash
Abstract
Karabash (Russian: Карабаш) is a town in Chelyabinsk Oblast, Russia, located 90 kilometers (56 mi) northwest of Chelyabinsk. It is also one of the largest copper-smelting centres in Russia.
The city and its suburbs have been plagued by acid rain since the 1970s. Sulfuric-containing gas is produced in the copper smelting process, so it is not discharged and purified. After a century and a half of copper mining, the city's plant life has all but disappeared, and the ecosystem of the surrounding area has been destroyed. Metal pollution has brought special geographical features to the area, in which there are red lakes and red lands and red gullies. The people living in the area are living in a challenging situation. Therefore, we want to publicize the unique landscape of this place and hope that people will pay attention to this place and that they can visit this place from the virtual space so that the economy of this area can be improved and then used for environmental improvement.
To restore the pollution information of Karabash, we collect the data related to the impact of pollution on local geo-climatic details, such as land cover, snowfall, climate change, etc. Later, we collect the embodiment of corruption in landscape patterns, including soil pollution texture and water pollution texture for GAN learning, and derive the pollution. The texture information landscape model. For the same site, we made a model of the pollution pattern landscape in two sizes. Through the spatial information model to respond to this phenomenon, we share this beautiful polluted city online.
Landscape Pattern Data from Metal Pollution
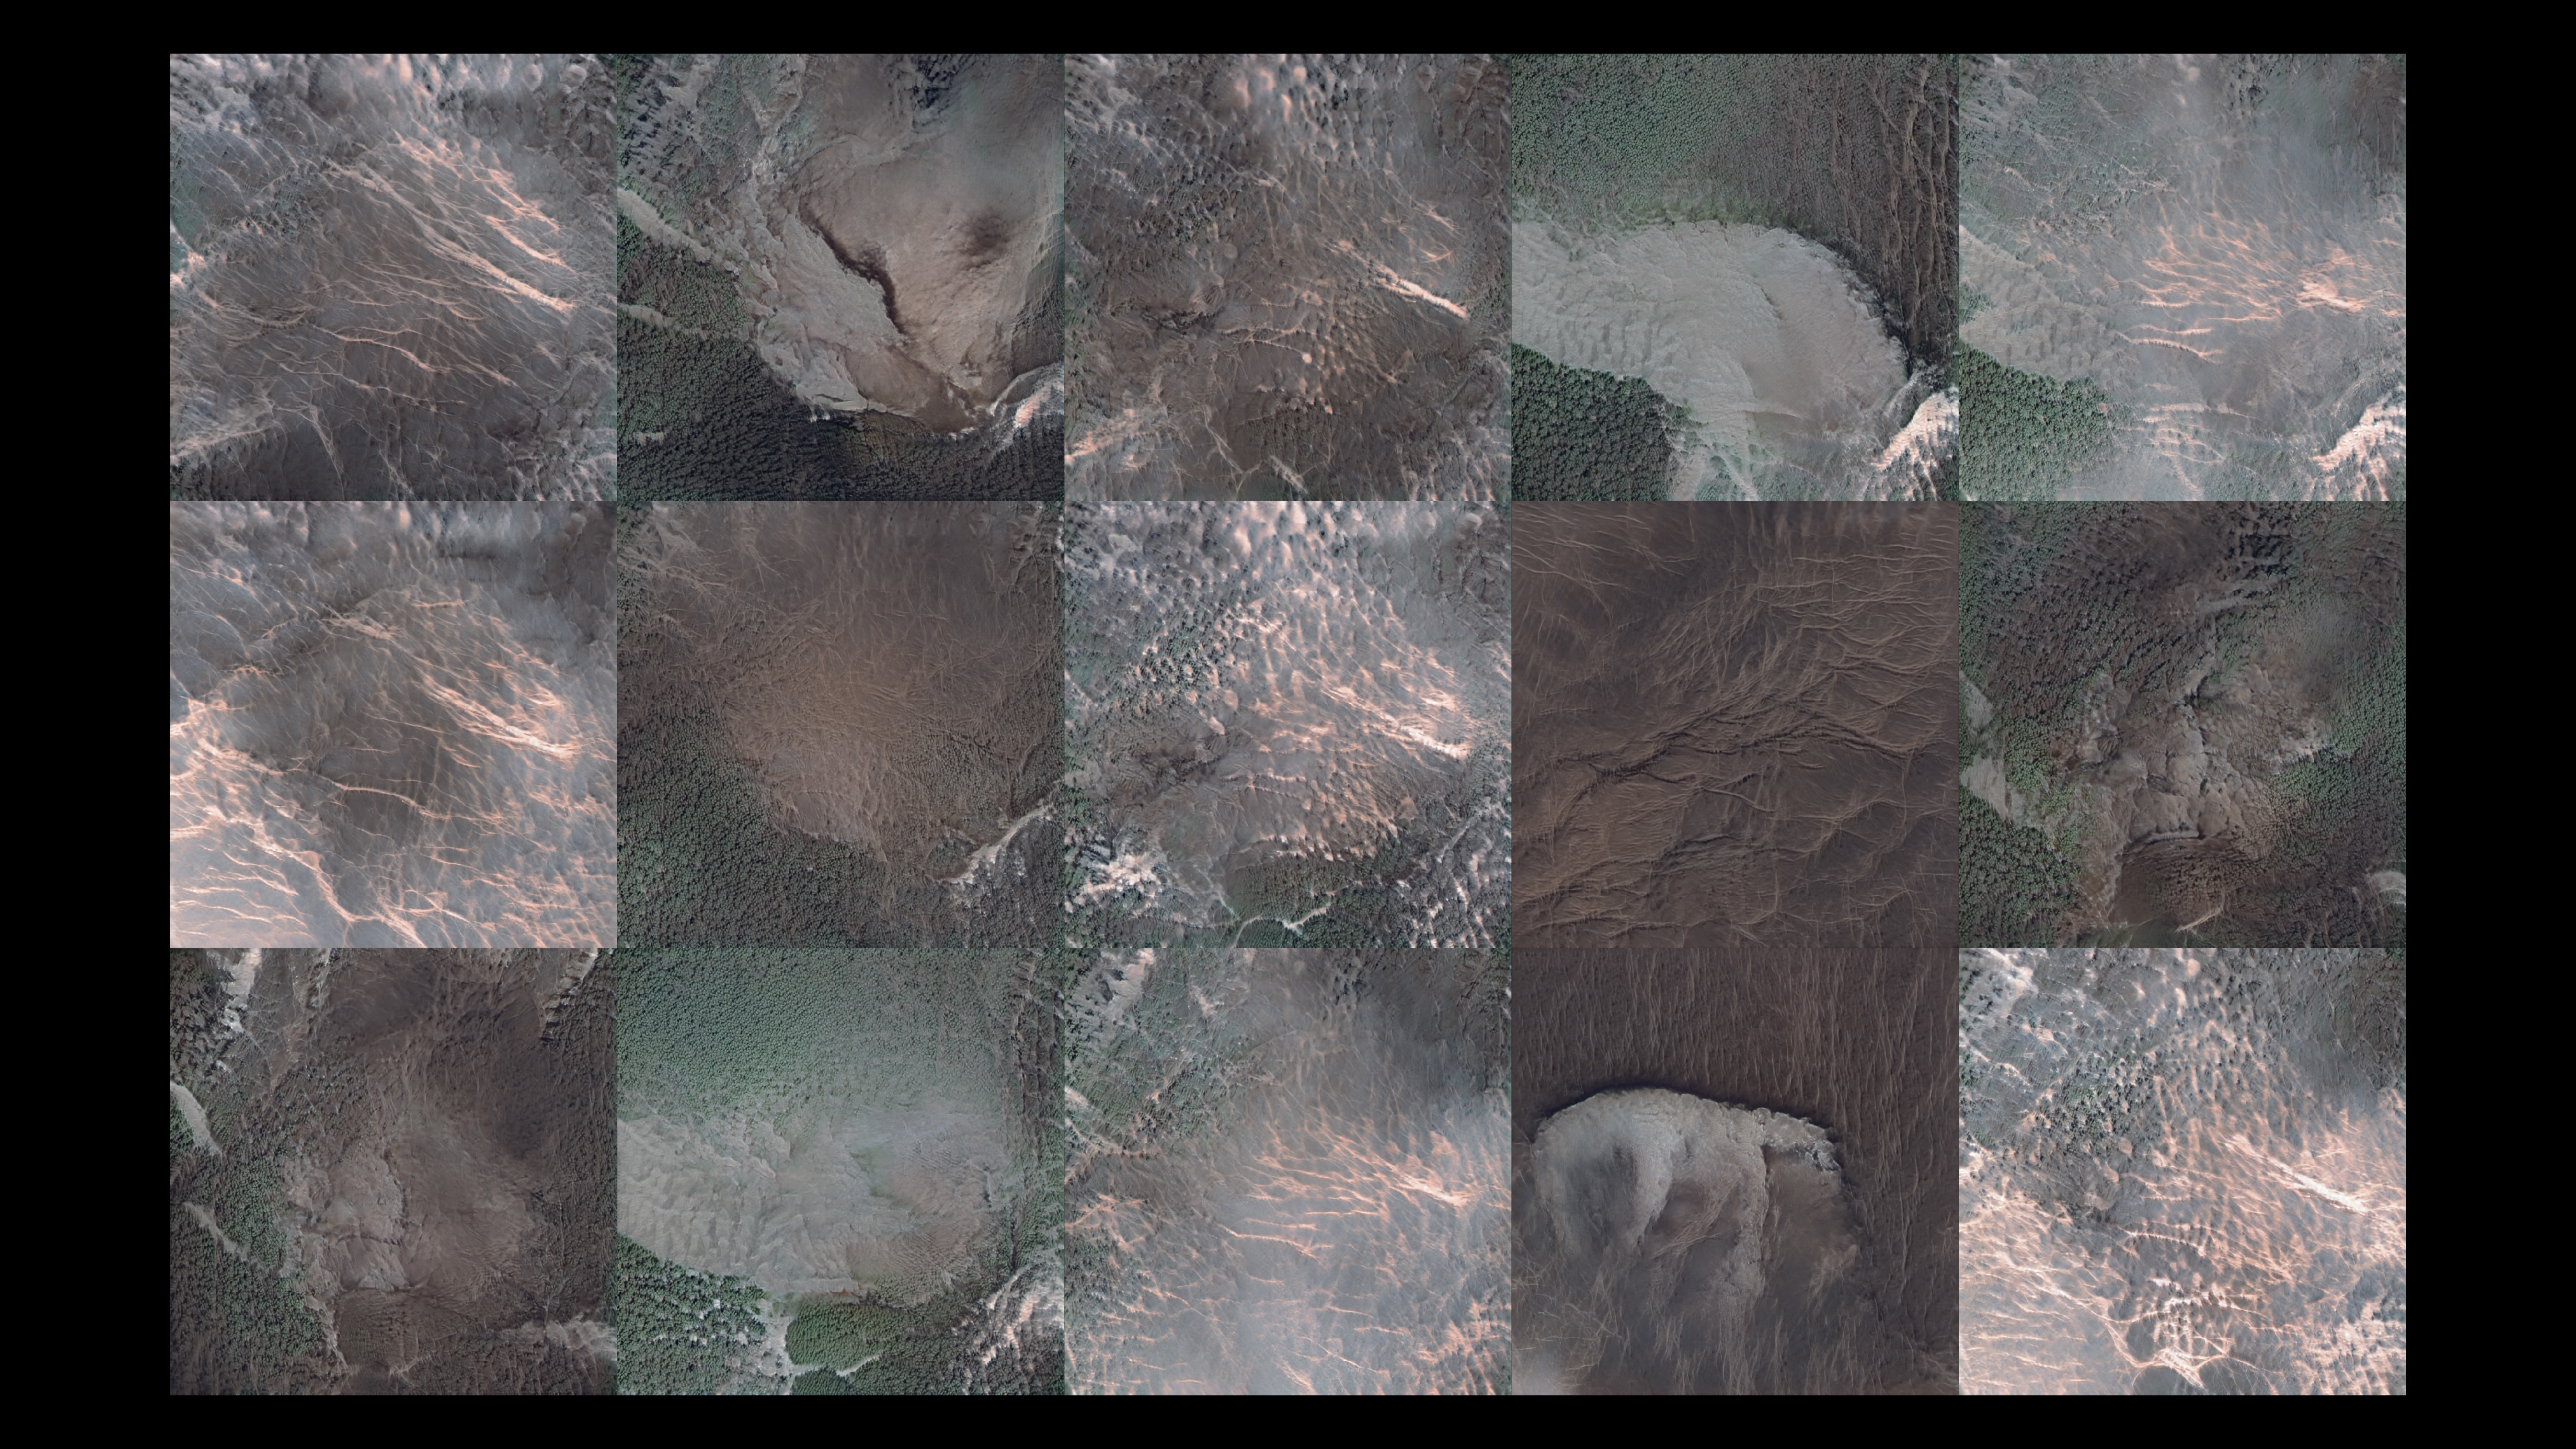
This project styleGAN is divided into three parts, firstly from Marco-scale (100KM) to study the information of the whole site and its surroundings. Sixteen levels of spatial information were selected, mainly forest change coverage, human facility coverage, and climate change (snow cover).
The second one is a selection of fifty satellite images (50M).
Featuring geographic information with unique patterns (geographic patterns such as red water and land due to metal pollution), which is the mesoscale part, at this size, you can see the geographic features in this place.
The third part is selected from the administrative area of Karabakh because of the influence of two factors, surface temperature change and snow cover, which will form water. The effect of the first two factors on the distribution of plants will have changes on the landscape, so the following three levels are selected: surface temperature change snow cover and Leaf Area Index (LAI) and Fraction of Photosynthetically Active Radiation (FAR), for each class, the years are 2004 to 2020, with two-year intervals, so that the changes between these levels can be seen.
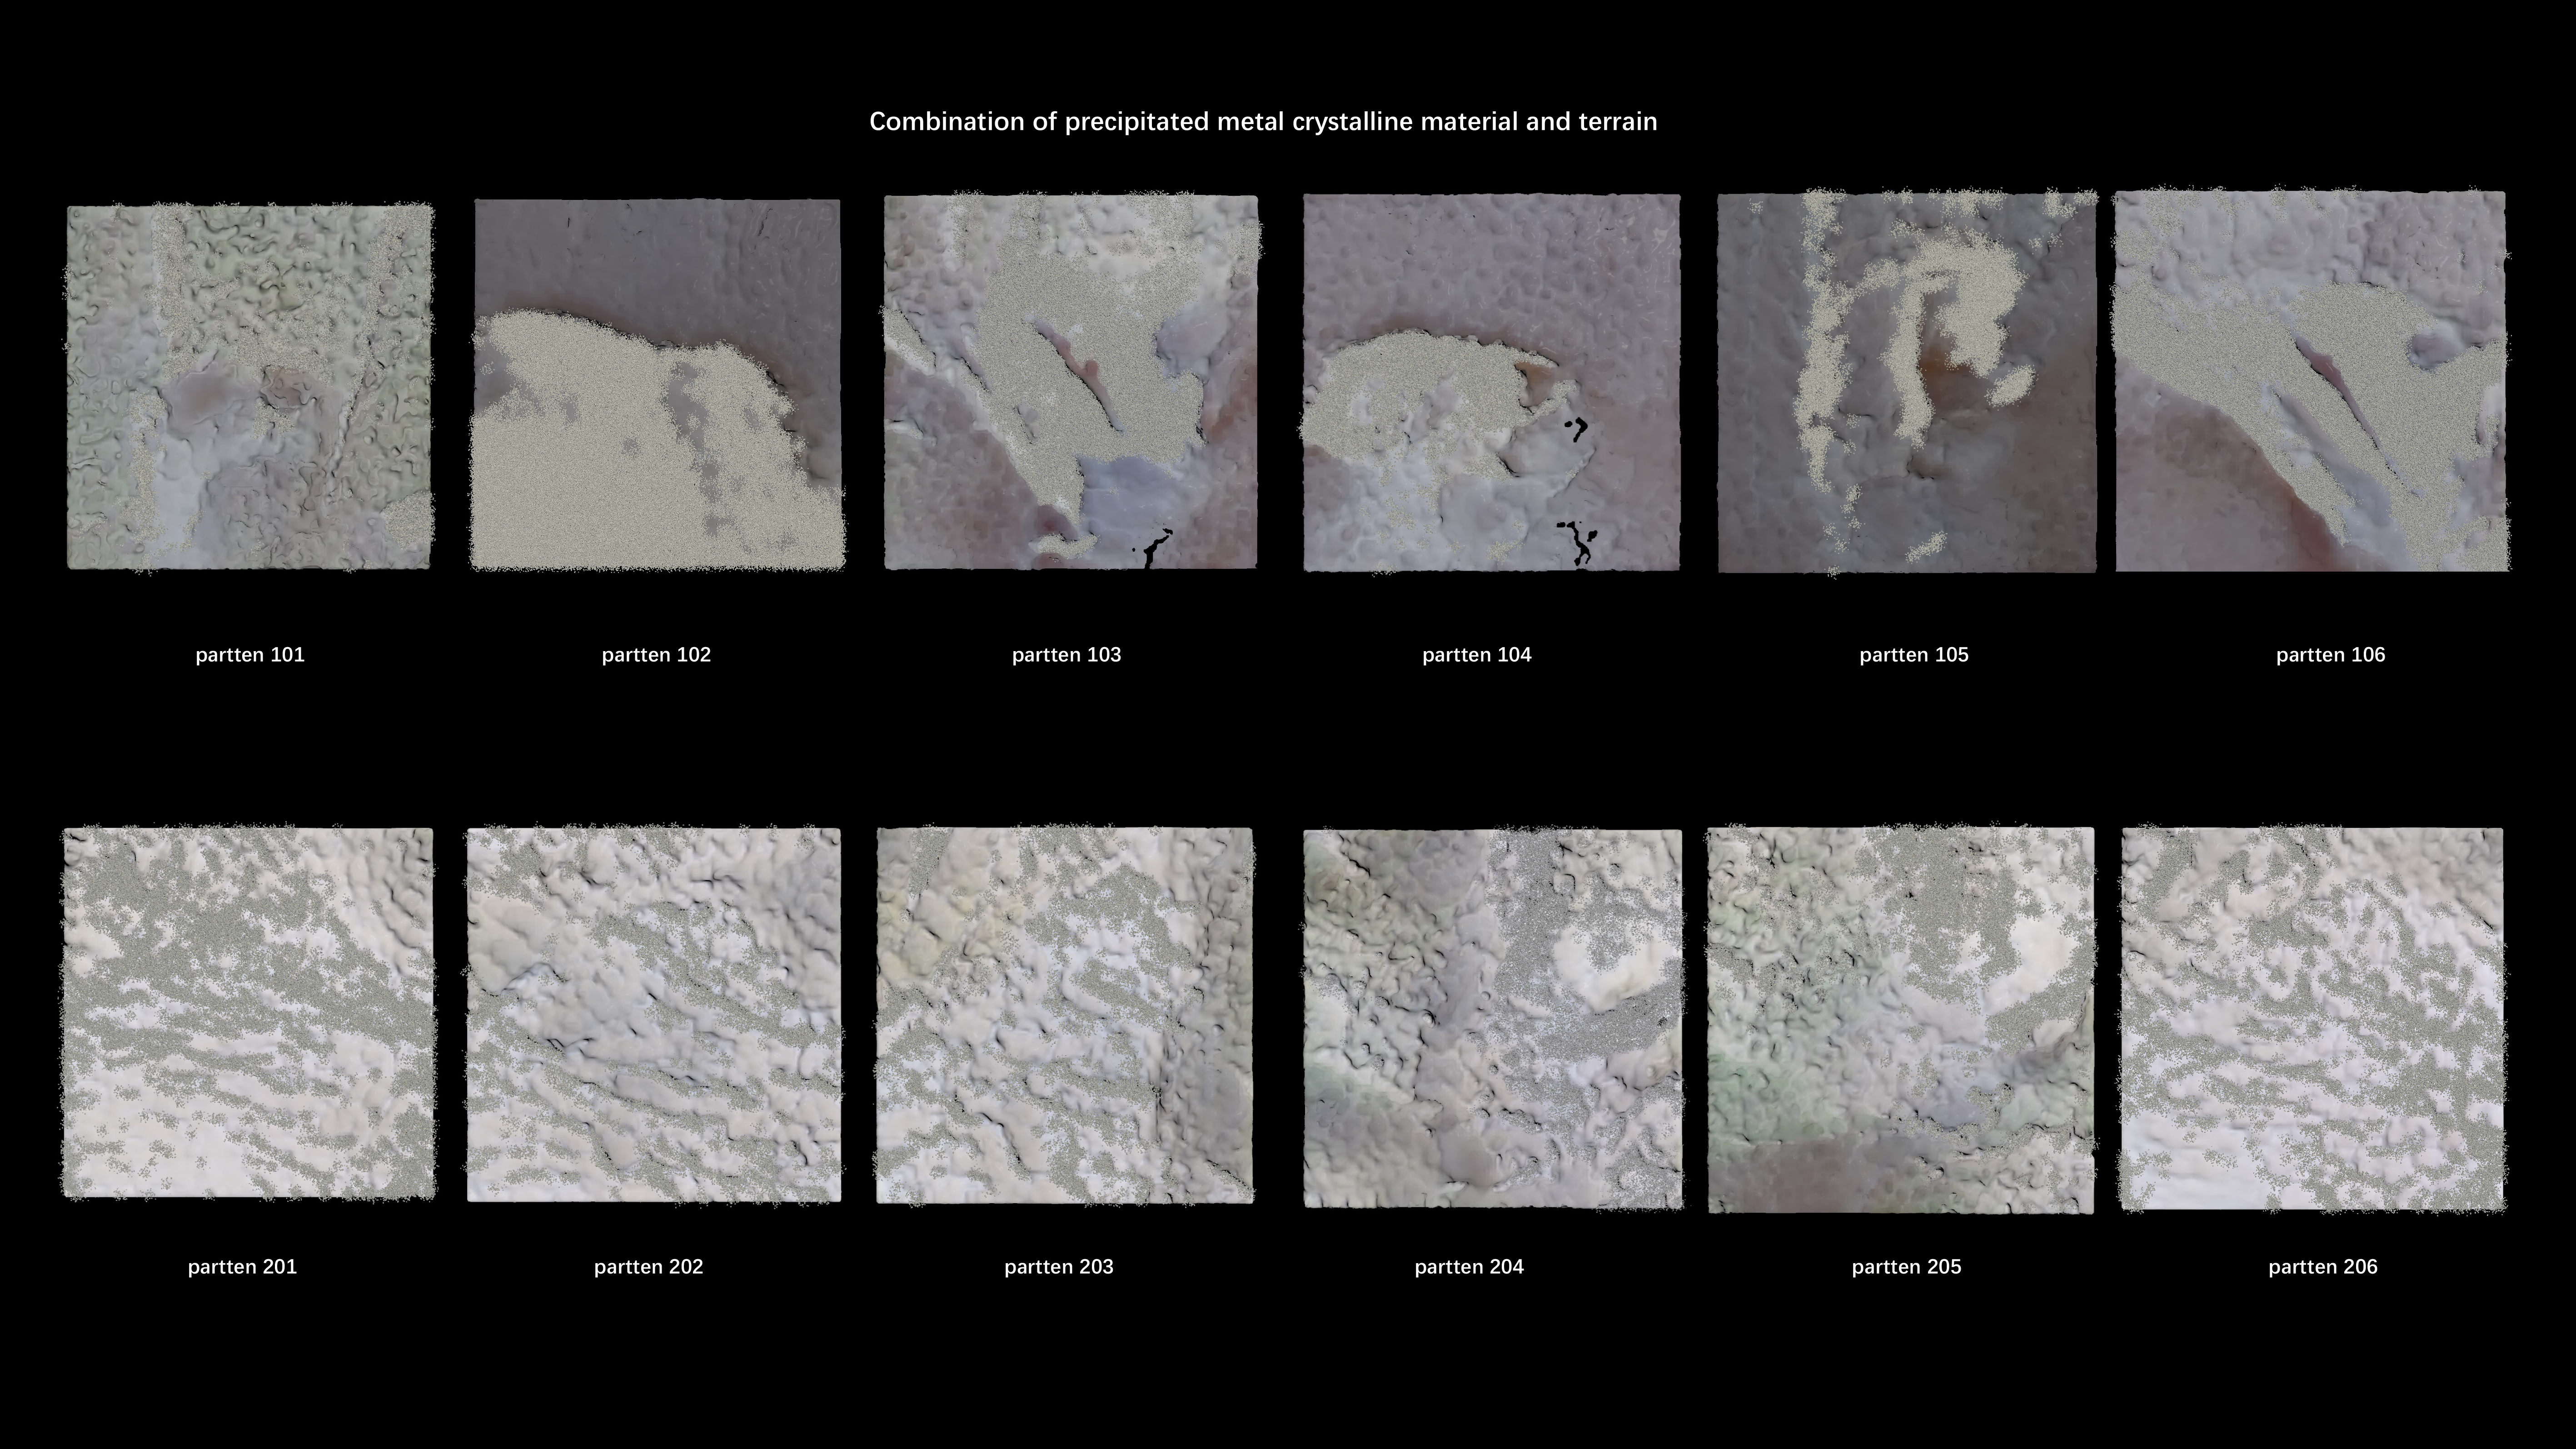
Metal Contamination to Crystal Landscape Transformation
We input two different sets of data, styleGAN 1 (Marco-scale: 100KM) and styleGAN 2 (Meso-scale: 50M), and the output results of both groups can be seen in the styleGAN results. The image information shows the linear pattern of soil loss and the pattern of red land. These point clouds represent the local pollution information, and we adjusted the number of generated images from 150 to 1200 to derive as many pollution point cloud models as possible. Then we classified each pollution point cloud.
Metal Contamination to Crystal Landscape Transformation
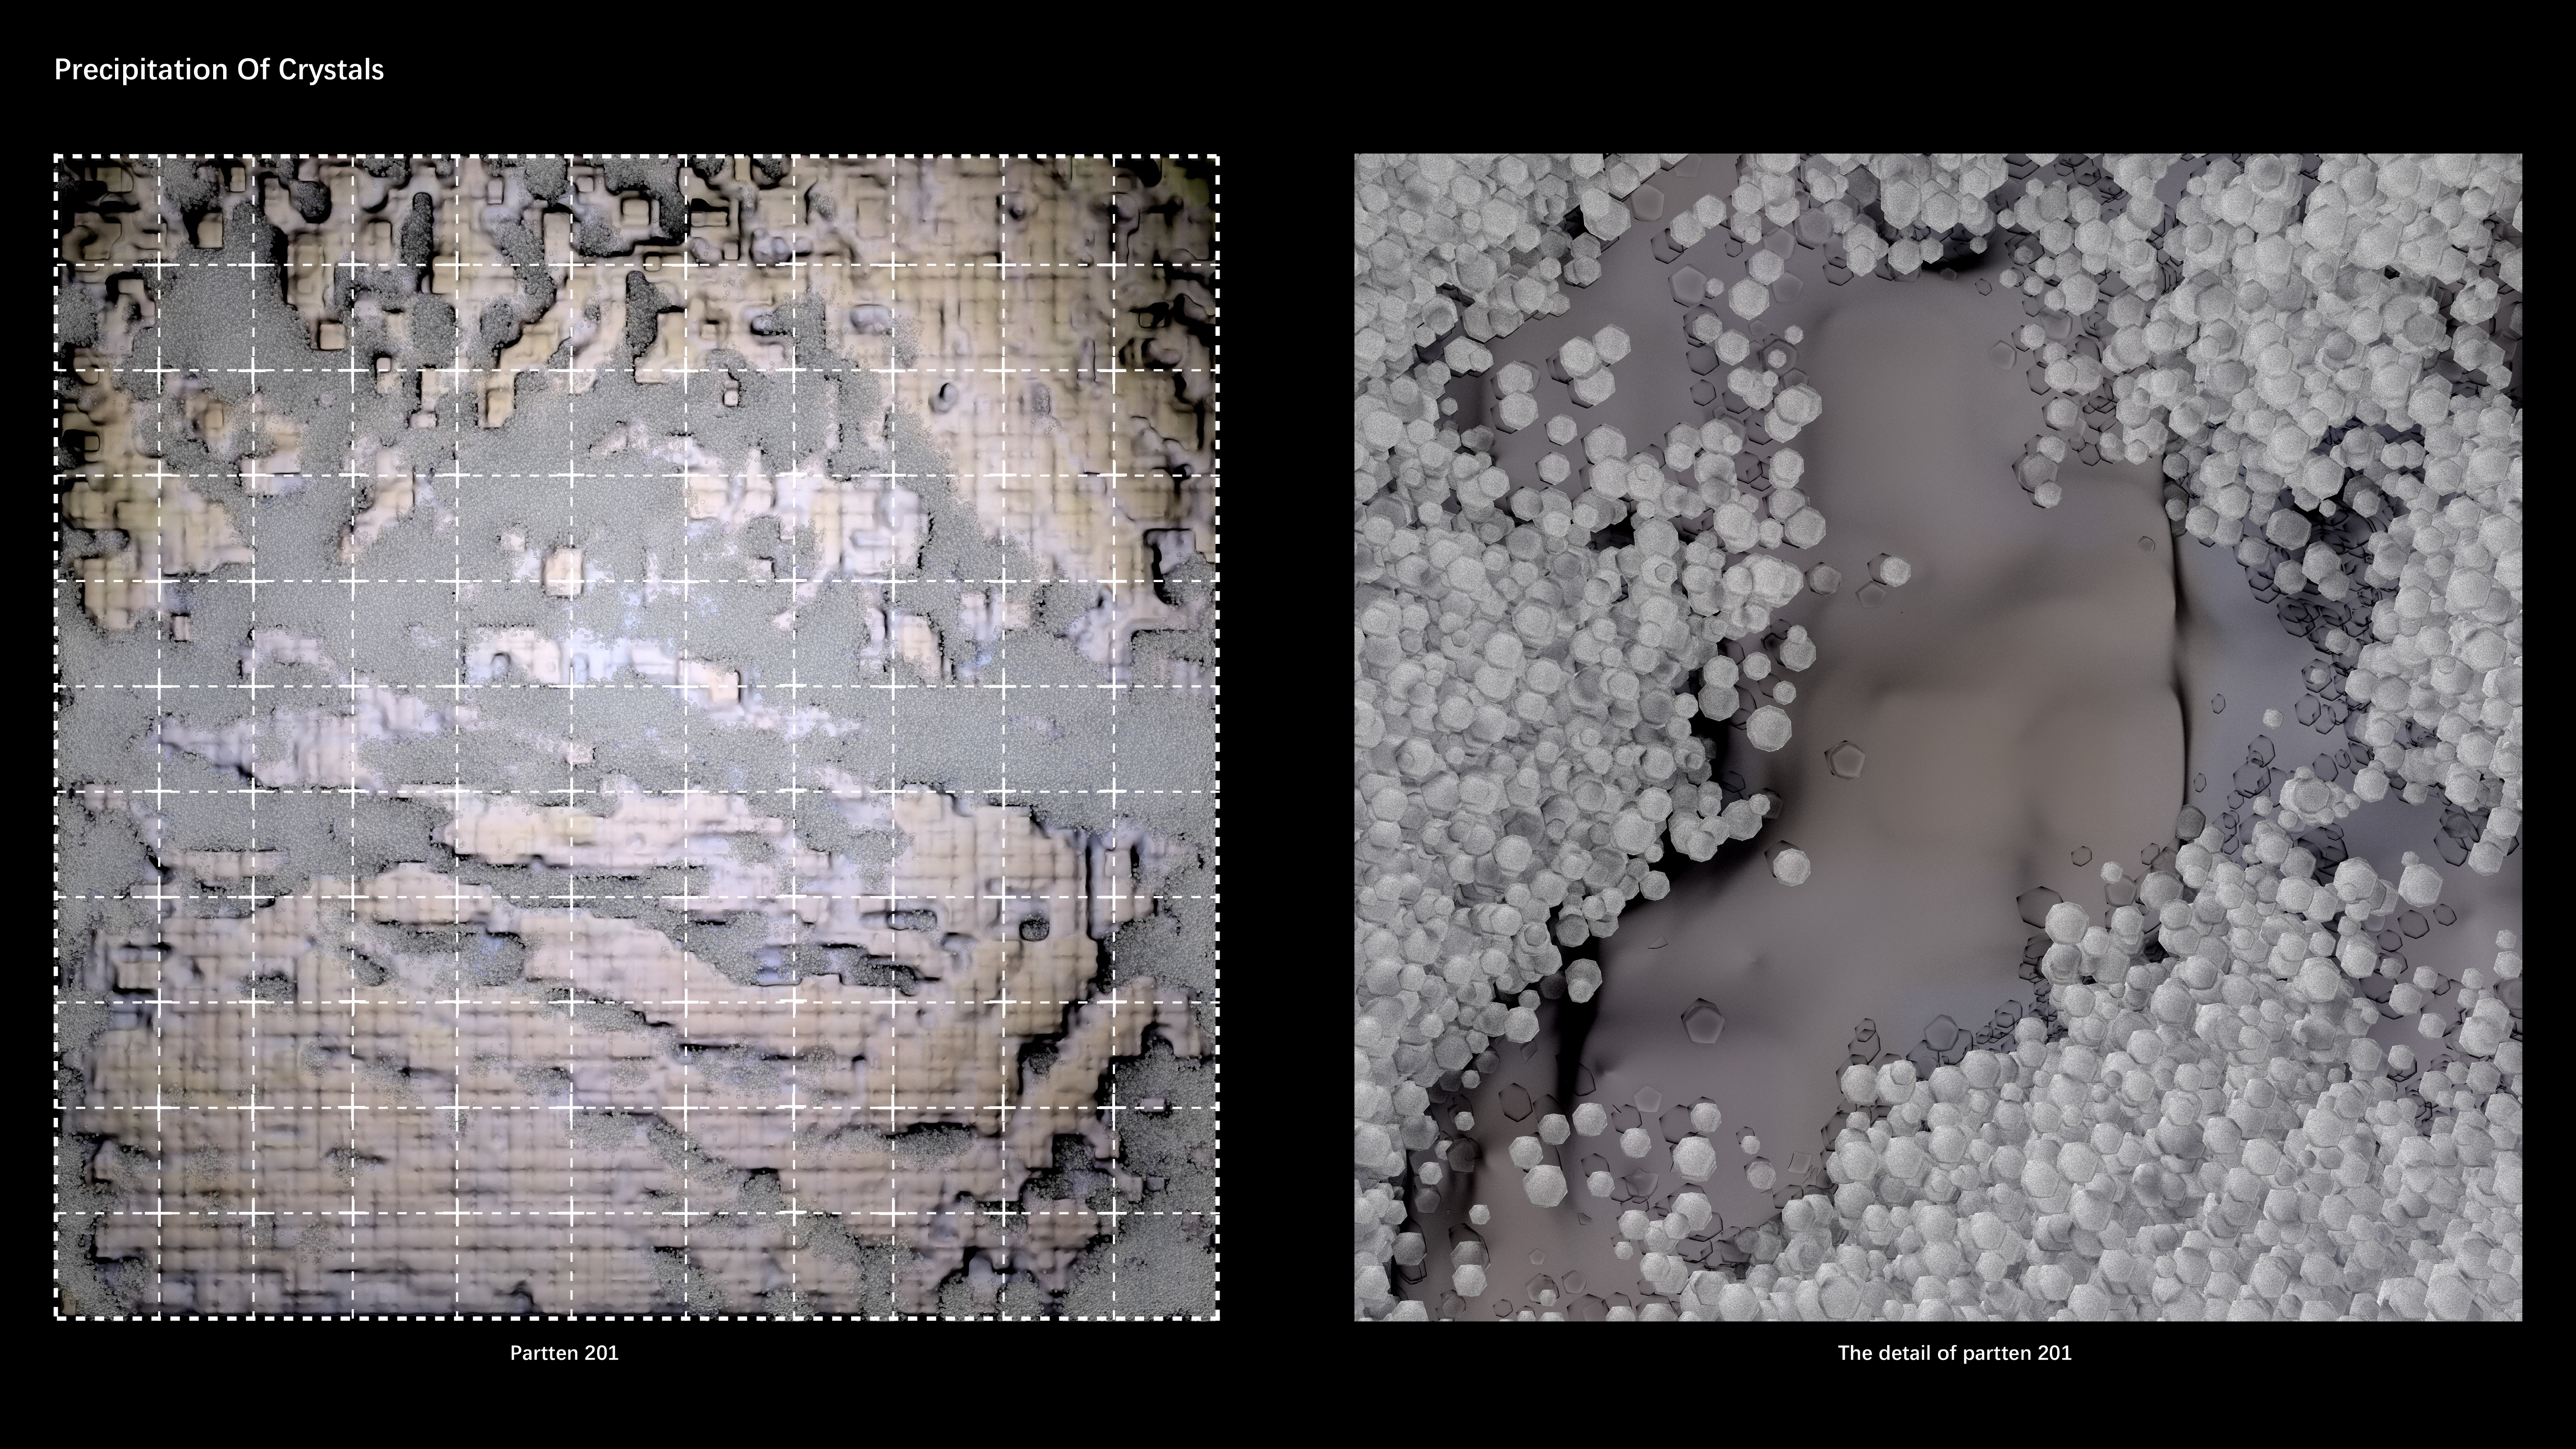
Based on the typology study of the landscape point cloud, the terrain point cloud is typologically classified to obtain two kinds of pollution texture patterns. After sorting them out respectively, the pixels representing pollution in each polluted terrain are selected, and each point is expanded into 50 points. Because there is a lot of lead in the pollution texture, the lead precipitates into dodecahedron crystals. Each point is transferred into a crystal to form the final pollution model.